Weekly U.S. trucking market update covering market rates, capacity, and key industry trends—plus what it means for shippers and how to stay ahead.

May 18, 2026 U.S. Trucking Market Report
Capacity Tightens as Produce Season and Enforcement Pressure Hit the Market
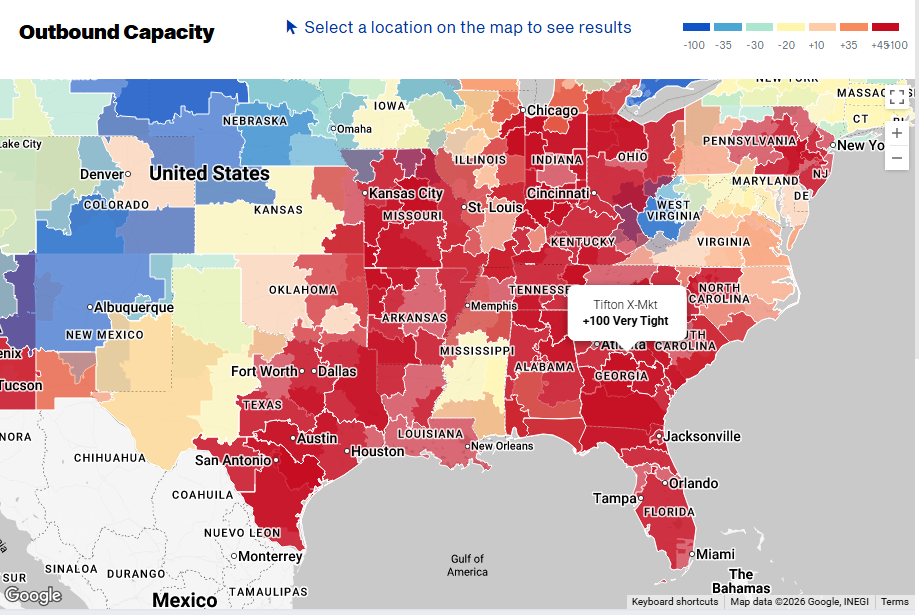
Freight markets continued strengthening through mid-May as produce season accelerated across the southern U.S. and the annual DOT International Roadcheck (“Blitz Week”) temporarily sidelined thousands of trucks and drivers nationwide. According to market participants and multiple industry data sources, truckload capacity tightened to levels not seen in years, placing additional pressure on shippers across refrigerated, dry van, and flatbed networks.
Truckload Rates Continue to Rise
National truckload spot rates increased across all major equipment types over the past week, according to DAT trend data. Reefer markets experienced the strongest tightening as produce harvest activity intensified throughout the Sun Belt, while flatbed and dry van markets also saw notable upward pressure.
Several factors are contributing to the current market environment:
- Seasonal produce demand is absorbing significant refrigerated capacity
- DOT Blitz Week inspections reduced available truck capacity nationwide
- Elevated fuel costs continue to pressure smaller carriers
- Freight demand has remained resilient despite broader economic uncertainty
The result has been a rapidly tightening market environment, particularly in the Southeast, Texas, California, and other major agricultural shipping regions.


Produce Season Driving Reefer Capacity Constraints
Produce season is now fully underway, creating significant disruption in refrigerated freight markets. As fresh produce volumes surge across the southern United States, reefer equipment is increasingly being pulled toward higher-paying agricultural lanes, leaving fewer trucks available for contracted food and manufacturing freight.
Shippers moving frozen foods, proteins, dairy, beverages, and other temperature-controlled products should expect:
- Longer lead times for truck availability
- Increased spot market volatility
- Higher rejection rates on lower-priced tenders
- Greater sensitivity around appointment flexibility and dwell time
This seasonal tightening is expected to continue into the summer months.
Logistics Managers’ Index Signals Tightening Conditions
The latest Logistics Managers’ Index (LMI) showed significant deterioration in transportation capacity during April, reinforcing what many shippers are already experiencing operationally.


Key takeaways from the report include:
- Transportation capacity contracted sharply
- Transportation utilization reached its highest level in at least two years
- Transportation pricing increased for the seventh consecutive month
- Respondents expect pricing pressure to continue rising in the months ahead
Taken together, these indicators suggest the trucking market is continuing its shift away from the historically soft conditions experienced throughout much of 2023 and 2024.
Fuel Costs Continue to Pressure Capacity
Fuel prices remain another major challenge for carriers and shippers alike. According to SONAR data, estimated diesel operating costs are currently averaging approximately $0.81 per mile nationwide.
.png?width=680&height=368&name=SONAR_Chart_Screenshot-2026-05-18%20(1).png)
Higher operating expenses continue forcing smaller carriers and owner-operators to either:
- Reduce operating areas
- Park equipment temporarily
- Exit the market altogether
This dynamic further reduces available capacity during already tight seasonal periods.
Supreme Court Ruling Raises Stakes for Broker Carrier Selection
Montgomery v. Caribe Transport II, LLC, one of the most significant legal developments impacting the logistics industry in decades came from the Supreme Court of the United States, which unanimously ruled that freight brokers may face negligent hiring lawsuits under state law for selecting unsafe motor carriers.
The decision is expected to have major implications across the freight brokerage industry, including:
- Increased scrutiny around carrier vetting procedures
- Greater emphasis on safety monitoring and compliance technology
- Potential increases in insurance and legal exposure
- Higher operational standards for broker-carrier partnerships
For shippers, the ruling reinforces the importance of working with logistics providers that maintain rigorous carrier qualification and monitoring programs. For Brokers, it drives home the importance of having sound, industry-leading carrier vetting procedures documented and enforced.
DOT Roadcheck Week Impacts Capacity
The annual CVSA International Roadcheck inspection event — commonly referred to as “DOT Blitz Week” — took place May 12–15 and contributed to temporary capacity disruptions across North America.
Inspection blitzes often remove non-compliant equipment and drivers from service, while many carriers proactively limit operations during enforcement periods. The combination of Roadcheck Week and produce season created an unusually tight freight environment in several major markets. Reports of up to 30% of inspected vehicles being sidelines sent shockwaves through the industry.
What Shippers Should Expect Moving Forward
Current market indicators suggest tightening conditions may continue throughout Q2 and into the summer shipping season. While the market has not fully returned to the extreme conditions seen during the 2021 freight surge, the balance of power is gradually shifting away from shippers and back toward carriers.
Shippers can help minimize disruption by:
- Providing longer lead times on tenders
- Increasing appointment flexibility where possible
- Improving load consistency and forecast visibility
- Prioritizing carrier and broker relationships over transactional pricing
- Planning ahead for produce and holiday shipping surges
As capacity continues tightening, strategic transportation partnerships and proactive planning will become increasingly important for maintaining service reliability and controlling costs.
Prepared by OverDrive Logistics for customer education and market awareness.
Source references include DAT, SONAR, LMI, and industry reporting.