Bi-Weekly U.S. trucking market update covering market rates, capacity, and key industry trends—plus what it means for shippers and how to stay ahead.
The Fireworks Are Over—but the Freight Market Is Still Making Noise
The July 4 holiday has passed, but the capacity pressure that developed ahead of the shortened week has not fully disappeared. National broker-posted spot rates averaged $3.06 per mile for dry van and $3.47 per mile for refrigerated freight during the week of June 28 through July 4. Tender rejections have eased as carriers return to normal schedules, but rejection rates remain elevated across dry van, refrigerated and flatbed freight. With produce activity shifting north and west and continued carrier failures disrupting available capacity, shippers should prepare for continued regional volatility throughout July and early August.
Truckload Rates Ease After the Holiday—but Remain Firmly Elevated
The National Truckload Index rose from roughly $2.30 per mile last summer to a current level of $3.56, an increase of more than 50%. Rates accelerated sharply beginning in March, then moved above $3.50 in late May as seasonal demand, tighter capacity, and the July 4 holiday pressured the market.
.png?width=1428&height=712&name=SONAR_Chart_Screenshot-2026-07-13%20(2).png)
The recent decline from approximately $3.75–$3.80 to $3.56 is a normal post-holiday correction—not evidence that the market is weakening materially. The index remains about 29% above its $2.76 average and well above the pricing levels seen throughout most of the past year.
Takeaway: The market has reset at a higher pricing level. Capacity may be loosening slightly after the holiday, but carriers still have substantial leverage, and shippers should not expect rates to quickly return to last year’s levels. Continued volatility is likely, with upward pressure remaining on high-demand and capacity-sensitive lanes.
Tender Rejections Ease After July 4—but Remain Elevated
The national Dry Van Outbound Tender Rejection Index currently sits at 16.91%, compared with 22.87% for refrigerated freight and 24.55% for flatbed. Rejections across all three equipment types eased following the July 4 holiday but remain elevated, signaling that capacity is still constrained and carriers retain meaningful pricing leverage.
.png?width=1428&height=712&name=SONAR_Chart_Screenshot-2026-07-13%20(1).png)
-
Dry Van — 16.91%: Capacity has improved modestly following the holiday but remains tighter than normal, supporting elevated carrier pricing.
Refrigerated — 22.87%: More than one in five tenders are being rejected as produce demand and seasonal food shipments compete for available equipment.
Flatbed — 24.55%: Flatbed remains the tightest major equipment segment, with rejection levels signaling continued carrier leverage.
Market takeaway: Capacity is returning after the holiday, but rejection rates remain too elevated to characterize the market as balanced or shipper-favorable.
Produce Season Shifts Capacity North and West
As harvest activity shifts north and west, refrigerated capacity will tighten in key growing regions, leading to higher spot rates, longer lead times, and increased competition for dependable reefer equipment.
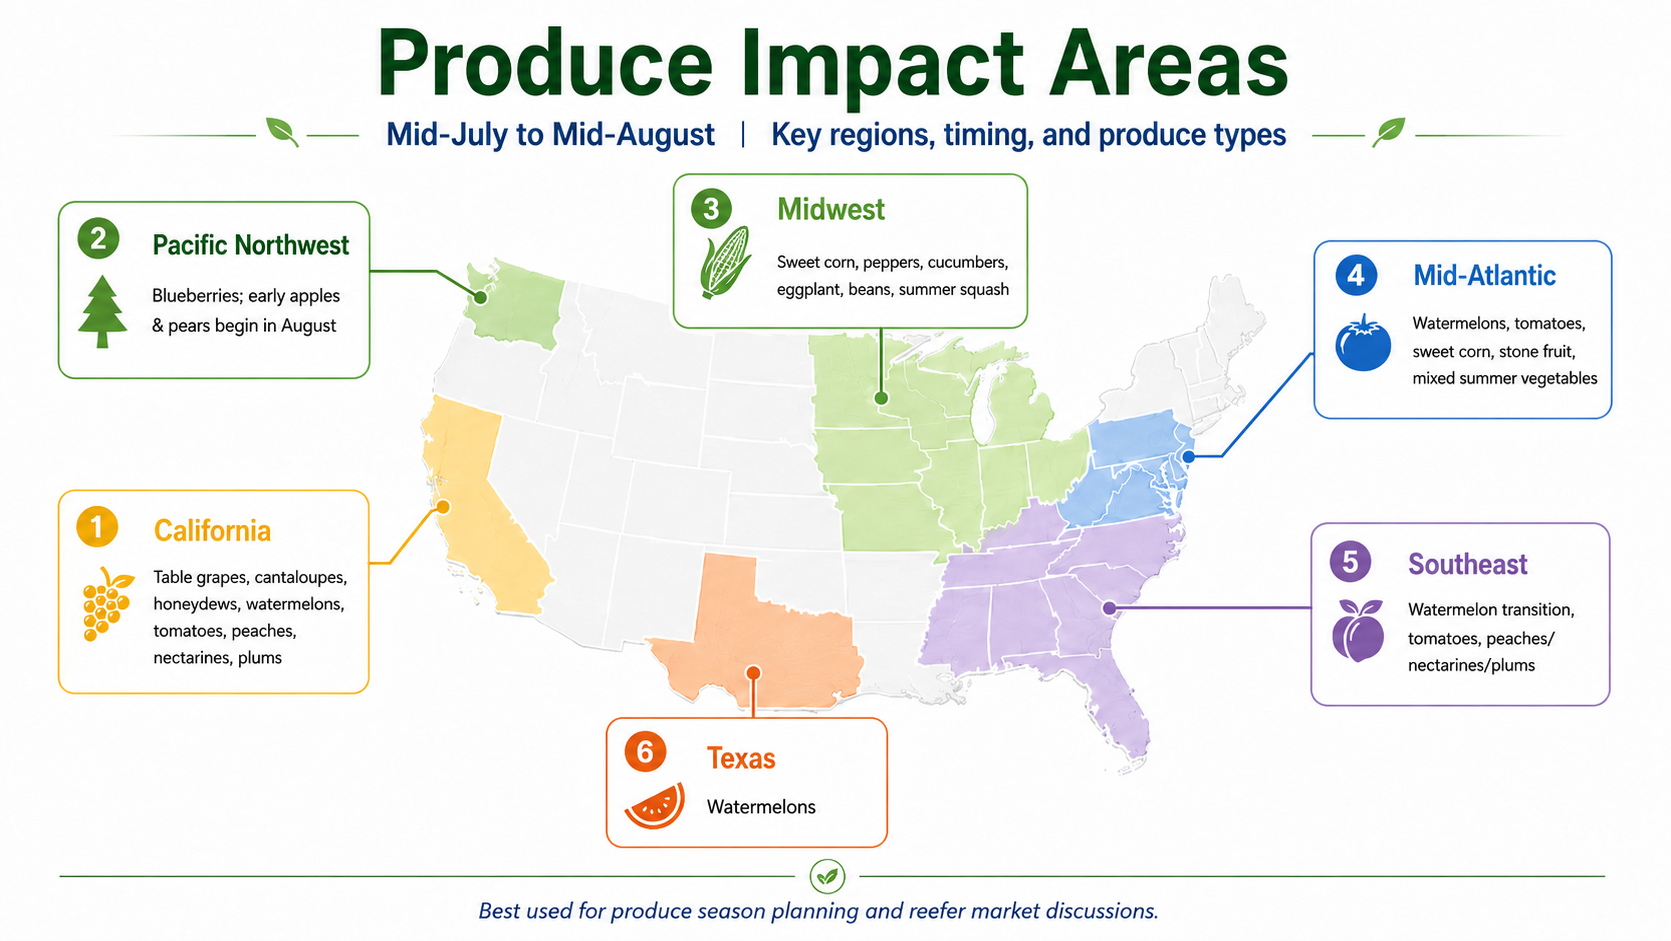
Produce Season Impacts by Region
| Region | Key commodities | Expected freight impact |
|---|---|---|
| California | Grapes, melons, tomatoes, stone fruit | Strongest reefer pressure over the next 30 days |
| Pacific Northwest | Blueberries, early apples and pears | Gradually tightening outbound capacity |
| Midwest | Sweet corn, peppers, cucumbers, squash | Localized regional and short-haul demand |
| Mid-Atlantic | Watermelons, tomatoes, corn, stone fruit | Temporary East Coast capacity imbalances |
| Southeast | Watermelons, tomatoes and stone fruit | Equipment repositioning northward |
| Texas | Watermelons | Steady regional reefer demand |
Carrier Failures Reinforce a Fragile Capacity Environment
The U.S. trucking market continued to shed capacity during the first half of 2026. From January through June, at least 26 documented trucking and logistics companies shut down, became inactive or entered liquidation—an average of 4.3 companies per month.
Those closures affected at least:
- 3,234 trucks, averaging approximately 539 trucks per month
- 3,592 drivers, averaging approximately 599 drivers per month
The totals were heavily influenced by the shutdown of 10 Roads Express, which accounted for 2,462 trucks and 2,606 drivers. Excluding that single closure, the documented market exits still represented approximately 772 trucks and 986 drivers, or an average of 129 trucks and 164 drivers per month.
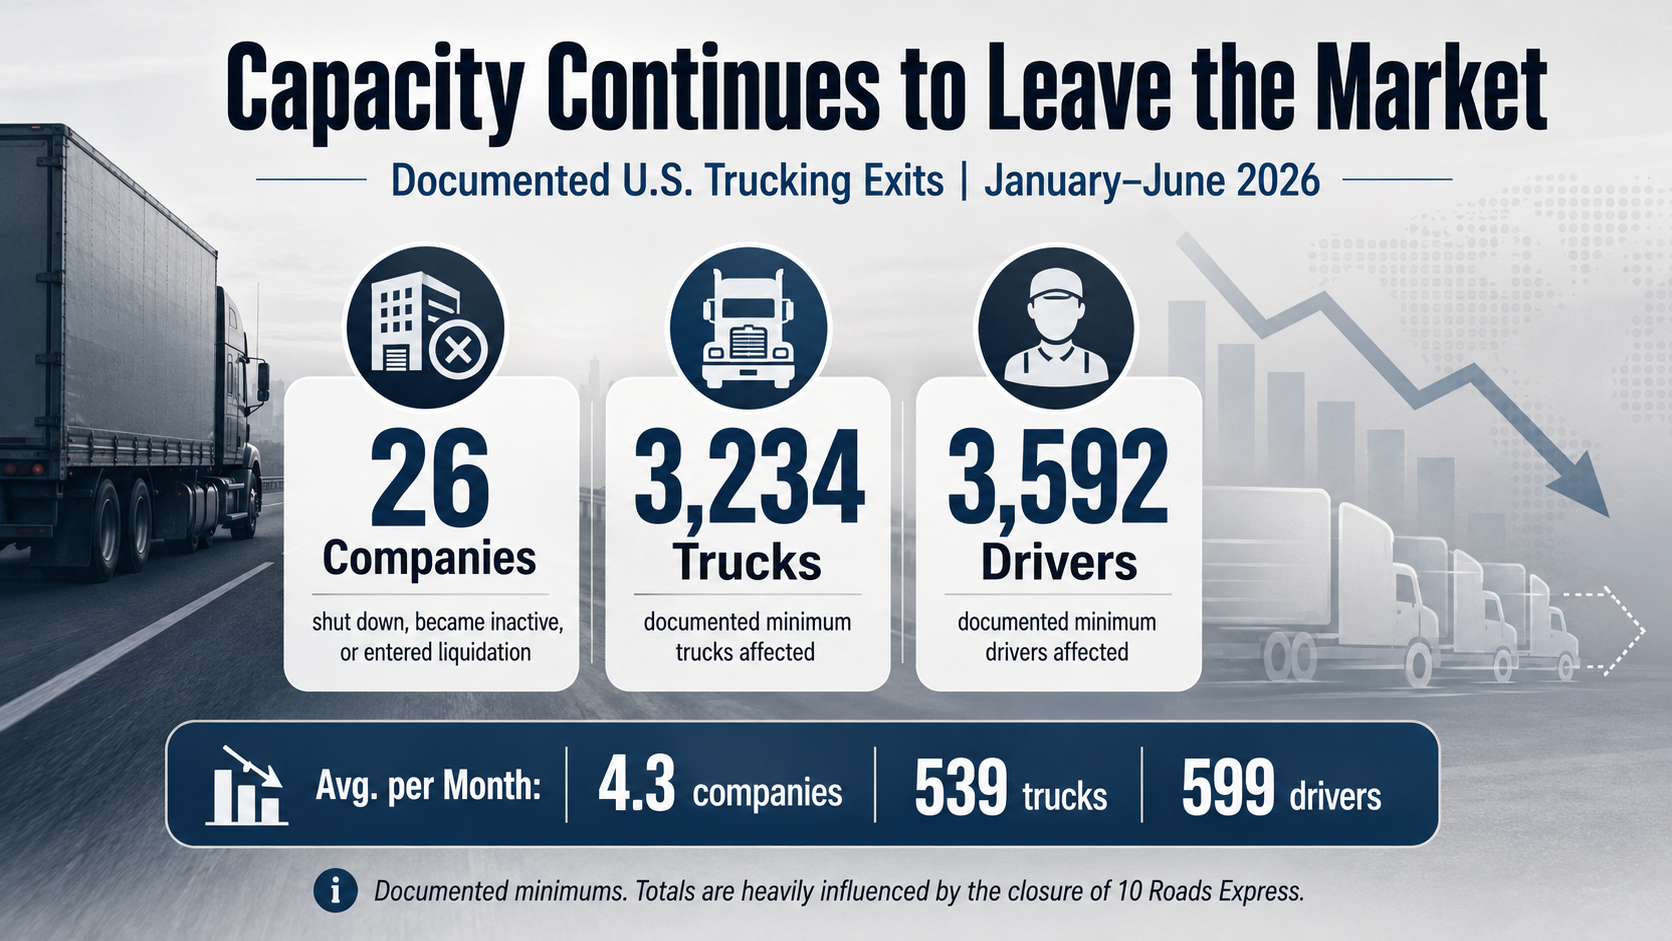
Not every truck or driver associated with a failed carrier permanently leaves the market. Some equipment is sold and some drivers join other fleets. However, repeated business failures disrupt established capacity networks, remove operating authority and increase market dependence on larger or better-capitalized carriers.
What Shippers Should Expect Next
- Protect reefer capacity early: Book produce-sensitive lanes several days earlier than normal, particularly from California, the Pacific Northwest and the Mid-Atlantic.
- Avoid assuming immediate post-holiday relief: Tender rejections have declined, but current levels still support carrier pricing.
- Review routing-guide depth: Confirm backup carriers before peak produce volumes create localized capacity shortages.
- Expect regional volatility: National indexes may ease while individual produce and flatbed markets remain highly constrained.
- Monitor carrier stability: Financial failures and insurance, maintenance and labor costs continue to pressure smaller fleets.
Prepared by OverDrive Logistics for customer education and market awareness.
Source references include FreightWaves, DAT, SONAR, USDA, and other industry reporting.