Bi-Weekly U.S. trucking market update covering market rates, capacity, and key industry trends—plus what it means for shippers and how to stay ahead.
World Cup 2026, Independence Day & Freight Fireworks. Welcome to the summer of 2026!
As Americans prepare for Independence Day cookouts and fireworks, the freight market is putting on a show of its own. Dry van and reefer spot rates have climbed to record highs, flatbed capacity remains exceptionally tight, and carriers continue to hold the upper hand despite rejection rates easing slightly from their spring peaks.
Behind every backyard barbecue—from burgers and hot dogs to beverages and fireworks—is a supply chain working overtime to keep America stocked.
This month's report explores what's driving today's truckload market and what shippers should expect during the second half of the summer. We'll also take a behind-the-scenes look at one of the most impressive logistics operations in the world: transporting and installing the living grass used for the 2026 FIFA World Cup.
No Yellow Card for Spot Rates—they're Still Charging Ahead
After a brief mid-June pause, truckload spot rates are moving higher once again. Dry van and reefer spot rates dipped approximately 4% before rebounding as shippers prepare for the July 4th holiday shipping surge.
.png?width=732&height=365&name=SONAR_Chart_Screenshot-2026-06-29%20(3).png) Dry Van
Dry Van
-
National spot rates reached a record $3.74 per mile.
-
Dry van spot rates are now 62% higher than a year ago.
-
While higher diesel prices have contributed to the increase, fuel explains only about 13% of the year-over-year rise, indicating that tightening capacity and improving freight demand remain the primary drivers.
Reefer
-
National spot rates also reached a record high of $3.72 per mile.
-
One of the most notable developments is the near parity between dry van and reefer pricing. Historically, reefer rates have commanded a 15–18% premium over dry van rates due to specialized equipment and operating costs. Today, however, average spot rates for both equipment types are nearly identical across most markets and lanes—a clear sign of an unusually tight freight market.
Flatbed
-
-
National flatbed spot rates eased slightly to $4.10 per mile, but remain above the $4.00 mark.
-
Although rates have softened from the record highs seen over the past two months, flatbed capacity remains extremely constrained.
-
With peak construction season underway, continued data center expansion, strong infrastructure spending, and limited equipment availability, flatbed rates are expected to remain at or near historic highs through the summer.
-
Bottom Line
The brief pullback in spot rates appears to have been temporary. As freight demand strengthens and capacity remains tight, carriers continue to maintain pricing power, with all three equipment types trading at historically elevated levels heading into the second half of the year.
Did You Know?
The Fourth of July isn't just America's birthday—it's also one of the year's biggest freight events. Grocery, beverage, produce, meat, and retail shipments all spike in the weeks leading up to the holiday, making late June and early July one of the busiest shipping periods of the year.
Carrier Capacity Is Still On The Attack
While pricing continues to move higher, rates tell only part of the story. Capacity trends provide an even clearer picture of where the market is headed.
Carriers are still rejecting loads at a rate not seen since mid-2022. While the flatbed tender rejection rate has eased off the record highs seen in March, April, and May, the rate is still firmly in the “chaos” range of near 30%.
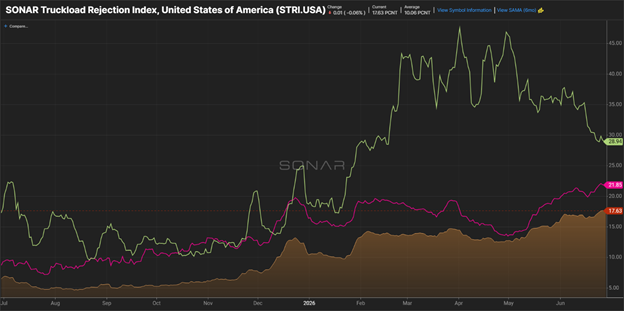
SONAR Truckload Rejection Index (Orange Line), USA – 17.63%
-
-
-
Represents the broad Truckload Rejection Index (STRI.USA).
-
Current levels are nearly double the long-term average shown on the chart (8.96%), confirming that contract compliance remains under pressure across the truckload market.
-
As this measure continues to climb, it continues to point to a carrier-favorable environment.
-
-
SONAR Flatbed Truckload Rejection Index (Green Line), USA – 28.94%
-
-
-
Peaked near 45% in early spring 2026 before easing back.
-
Even after the recent decline, rejection rates remain exceptionally high, indicating continued tight capacity and strong carrier leverage.
-
-
SONAR Reefer Truckload Rejection Index (Magenta Line), USA – 21.85%
-
-
-
Has steadily climbed since late 2025 after spending much of the previous two years below 10%.
-
While lower than the flatbed rejections, it remains at historically elevated levels and reflects sustained tightening across the market.
-
-
Overall Market Interpretation
All three measures tell the same story:
-
The truckload market has undergone a significant shift from the excess capacity that characterized 2023, 2024, and much of 2025.
-
Capacity tightened rapidly beginning in late 2025, with rejection rates reaching multi-year highs during the spring of 2026.
-
Recent flattening suggests the market is cooling somewhat, but rejection rates remain well above historical norms.
-
Shippers should continue to expect tighter capacity, firmer spot rates, and greater importance placed on strong carrier relationships and flexible planning.
Bottom Line: While the market is no longer tightening at dramatic rates, all three rejection metrics remain elevated, indicating that the truckload market continues to favor carriers and that capacity is still considerably tighter than the long-term average.
 Americans consume approximately 150 million hot dogs on the Fourth of July. That's enough to stretch from Washington, D.C., to Los Angeles more than five times—and it takes thousands of refrigerated truckloads to deliver them in time for the holiday.
Fuel Prices Continue a Slow Decline
Capacity may be driving today's market, but fuel costs remain one of the largest variables carriers and shippers continue to monitor.
As tensions in the Middle East begin to ease and traffic through the Strait of Hormuz gradually stabilizes, diesel prices are showing signs of retreating—although not nearly as quickly as they climbed.
.png?width=1200&height=800&name=On-Highway%20Diesel%20Fuel%20Prices%20(2).png)
Looking ahead, diesel prices remain difficult to predict. While easing geopolitical tensions have provided some relief, ongoing uncertainty in the Middle East, strong summer travel demand, and continued economic growth could keep prices elevated. Additional declines remain possible, but the market could just as easily stabilize—or begin climbing again.
Gooooal!! University of Tennessee pulls off the World Cup Logistics Hat Trick!
When millions of fans tune in to watch the 2026 FIFA World Cup, they'll be focused on spectacular goals, dramatic saves, and championship dreams. Few will notice what's happening beneath the players' feet—but perhaps they should.
Creating the perfect World Cup pitch is one of the most impressive supply chain operations in the world.
Long before the opening match, researchers at the University of Tennessee and turf experts across North America have been working to solve a remarkably complex challenge: how do you create identical playing conditions in 16 stadiums spread across three countries, each with different climates, weather patterns, and stadium designs?
The answer is years of research, engineering, and logistics.
Since 2017, University of Tennessee turfgrass researchers have partnered with FIFA to study everything from grass varieties and root systems to drainage, soil composition, and field performance. Their goal isn't simply to grow grass—it's to engineer a living playing surface that performs the same whether the match is in Atlanta, Dallas, Los Angeles, Toronto, or Mexico City.
Once the science is complete, the logistics begin.
Specialized Kentucky bluegrass is cultivated years in advance before being harvested into massive rolls, loaded onto refrigerated trailers, and delivered under tightly controlled conditions. Each stadium requires nearly 85,000 square feet of sod—roughly 27 to 30 truckloads—that must arrive within a narrow installation window before crews can assemble the playing surface weeks ahead of kickoff.
For many U.S. venues, the challenge is even greater. NFL stadiums that normally feature artificial turf must be completely converted to natural grass, with carefully engineered foundations, irrigation systems, drainage, and climate controls installed before a single blade of grass is placed.

It's a reminder that supply chain excellence isn't always about moving products from Point A to Point B. Sometimes it's about transporting a living product that cannot be delayed, damaged, or allowed to vary in quality.
The world's best logistics operations often go unnoticed. If the players never think about the field beneath them—and fans never question why every stadium feels the same—the supply chain has performed flawlessly.
That's what world-class logistics looks like.
When millions of fans watch the world's biggest sporting event this summer, they'll celebrate every goal, save, and trophy presentation. Few will ever think about the thousands of trucks, years of planning, and countless logistics professionals who made it all possible.
That's championship-level execution.
Final Whistle: Winning the Second Half of 2026
As the fireworks fade and the second half of summer kicks off, one thing is clear: this market still belongs to the carriers.
Record-high spot rates, elevated rejection rates, and tight capacity all point to a freight market where planning ahead is more valuable than shopping for last-minute capacity. The brief pause in June appears to have been exactly that—a halftime break, not the end of the match.
The best-performing shippers over the coming months will be the ones who:
- Plan early instead of relying on the spot market.
- Strengthen carrier relationships before capacity tightens even further.
- Remain flexible as fuel prices, seasonal demand, and market conditions continue to shift.
- Communicate proactively across their supply chains to avoid costly surprises.
Just like the teams competing for the 2026 FIFA World Cup, success won't come from one spectacular play. It will come from preparation, execution, and having the right team on the field.
Here's wishing everyone a safe and Happy Independence Day. We'll see you next month as we continue following the freight market—one goal, one mile, and one shipment at a time.
Prepared by OverDrive Logistics for customer education and market awareness.
Source references include DAT, SONAR, ASCM (Association for Supply Chain Management), UTK (University of Tennessee, Knoxville), and other industry reporting.